Virtual Visual Surveys
In 2015, SGCO was approached by Phoenix Heat Treating., a single source heat treating company. Providing leading-edge process automation heat treating services to customers in diverse industries from aerospace to automotive and pharmaceutical to high-tech. Located in Phoenix, Arizona
SGCO provided Phoenix Heat Treating with consulting, design, Technical programming and development services for Thermal Innovation Technologies, Inc.in Phoenix Arizona.
VVS is a cloud-based software for your temperature uniformity needs:
- VVS provides secure storage of your database of temperature profiles
- This software is used to view this data in a 3 D format
- Identifying failure points before an actual failure occurs
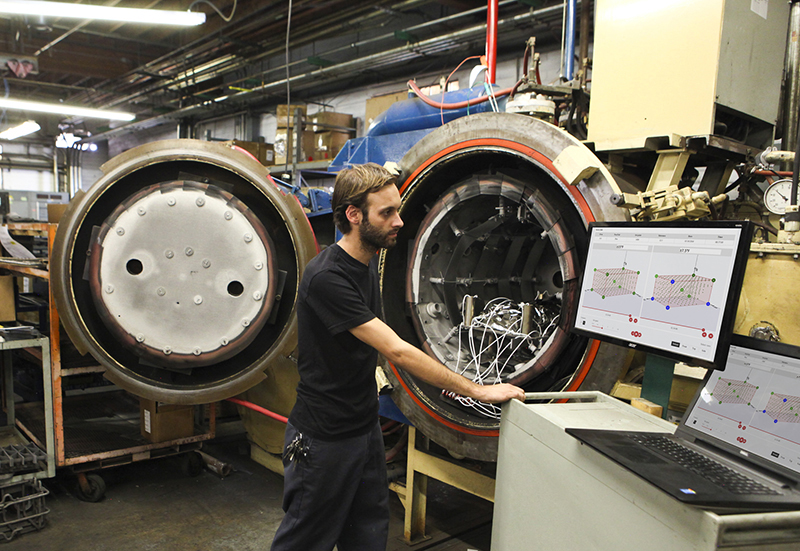
- Production can see inside the furnace to identify the best location for load size facility managers can direct their department identifying and visually seen and locating hot and cold spots and other areas inside the furnace that may fail
- VVS works by extracting excel data and transforming it into a 3D view allowing you to see inside the furnace as it approaches set point and stabilizes.
Virtual visual surveys VVS is a cloud-based software for your temperature uniformity needs VVS provides secure storage of your database temperature profiles for each piece of equipment, with ability to see the survey in 3D. VVS allows all key players in your organization to see what the uniformity of your furnace looks like. Quality managers can access the likelihood of successfully passing temperature uniformity surveys. Production managers can determine the location in the furnace to achieve the best possible results for the material being processed. Factory managers can determine the location of problems determine the severity and plan accordingly to maximize furnace up time. VVS works by extracting Excel spreadsheet data and transforming it into a three-dimensional view allowing you to see inside your furnace as it approaches and maintains temperature uniformity.

VVS is user-friendly with easy to use sort and filter features for managing your survey database. This allows you to see all historical surveys for a particular furnace; you can sort by date and temperature. Access your survey and see a table View with all the time stamps you need to temperature as indicated by the recording thermo couples. Indication of whether the sensors are within tolerance out of tolerance and any observed overshoot as highlighted here. You can change the temperature uniformity tolerance to adjust how the videos going to display to you writing you more objective tools to use. Now you can more easily see hot and cold spots in the furnace that I previously passed customer requirements. You can see here the green indicates areas inside the furnace that are within the tolerance requirement, blue and lack of color here indicating an area inside the furnace that is out of tolerance. This provides an easy-to-use tool for maintenance to troubleshoot a furnace and where they need to look first. Also helps production and determining where best to place work inside the furnace for optimal results. This is also a tool quality can use for predicting when a survey will fail before it actually fails. You're also able to compare historical surveys to the most recent surveys. While the digital videos are playing that can be rotated, you can zoom in zoom out , you can start and stop. Also you can move video along one minute at a time to identify areas that are of Interest. VVS tools help you predict, and schedule maintenance events leading to better predictive control, reduce downtime and improve quality which all contribute to increase profits.
For more information please visit Virtual Visual Surveys.com